
The custom function is designed to generate custom benchmarks and view their Index Levels and Total Returns along with sector-region-wise PECCS allocations and risk profile values for a specified PECCS Ticker.
The provided template sheet and table can be utilized to perform this action. For detailed guidance on using this functionality, refer to this documentation.
Then these steps to be followed
-
Once the user has specified all the required values, they can proceed to generate the Index Levels using the Custom Benchmarks custom function.
To do this, use the custom function:
=PRIVATEMETRICS.CUSTOM_BENCHMARKS() -
This custom function accepts 2 mandatory arguments followed by a few optional arguments
-
indexId - The starting Index or Benchmark
-
constraintsRange – The cell range of the constraints
-
startDate - (Optional) The start date to compute the custom benchmarks
-
endDate - (Optional) The end date to compute the custom benchmarks
-
currency - (Optional) The currency to compute the custom benchmarks (GBP, EUR, USD, and LCU)
-
indexLevel - (Optional) A starting Index Level to compute the benchmarks. 1000 by default
-
showAllocations - (Optional) Flag to show/don't show allocations. FALSE by default
-
showRiskProfiles - (Optional) Flag to show/don't show risk profile data. FALSE by default
-
-
For example, based on the values in Fig 2 on the sample table page, if the user also wants to view the sector-region-wise allocations, the custom function's signature would look like this:
=PRIVATEMETRICS.CUSTOM_BENCHMARKS(B2, A12:E31, B4, B6, B8, B10, TRUE, TRUE)Here,
B2represents the Index Ticker andA12:E31represents the cell range containing the constraints.Note: As the response generation involves complex computations, it may take some time to complete based on the processing requirements. Currently, the timeout has been set to 2 minutes. If the call isn’t executed within 2 minutes, it is retried 3 times with the timeout for each subsequent call being increased by 1 minute. Users are advised to wait until the process finishes.
-
Similarly, if the user does not want to view the sector-region-wise allocations or the risk profiles table, the custom function's signature would look like this:
-
=PRIVATEMETRICS.CUSTOM_BENCHMARKS(B2, A12:E31, B4, B6, B8, B10, FALSE, FALSE)OR
-
=PRIVATEMETRICS.CUSTOM_BENCHMARKS(B2, A12:E31, B4, B6, B8, B10)
-
-
Once the response is successfully received, the results are displayed in a tabular format.
-
If the user selected to view the custom benchmarks along with allocations and risk profiles, the output would be
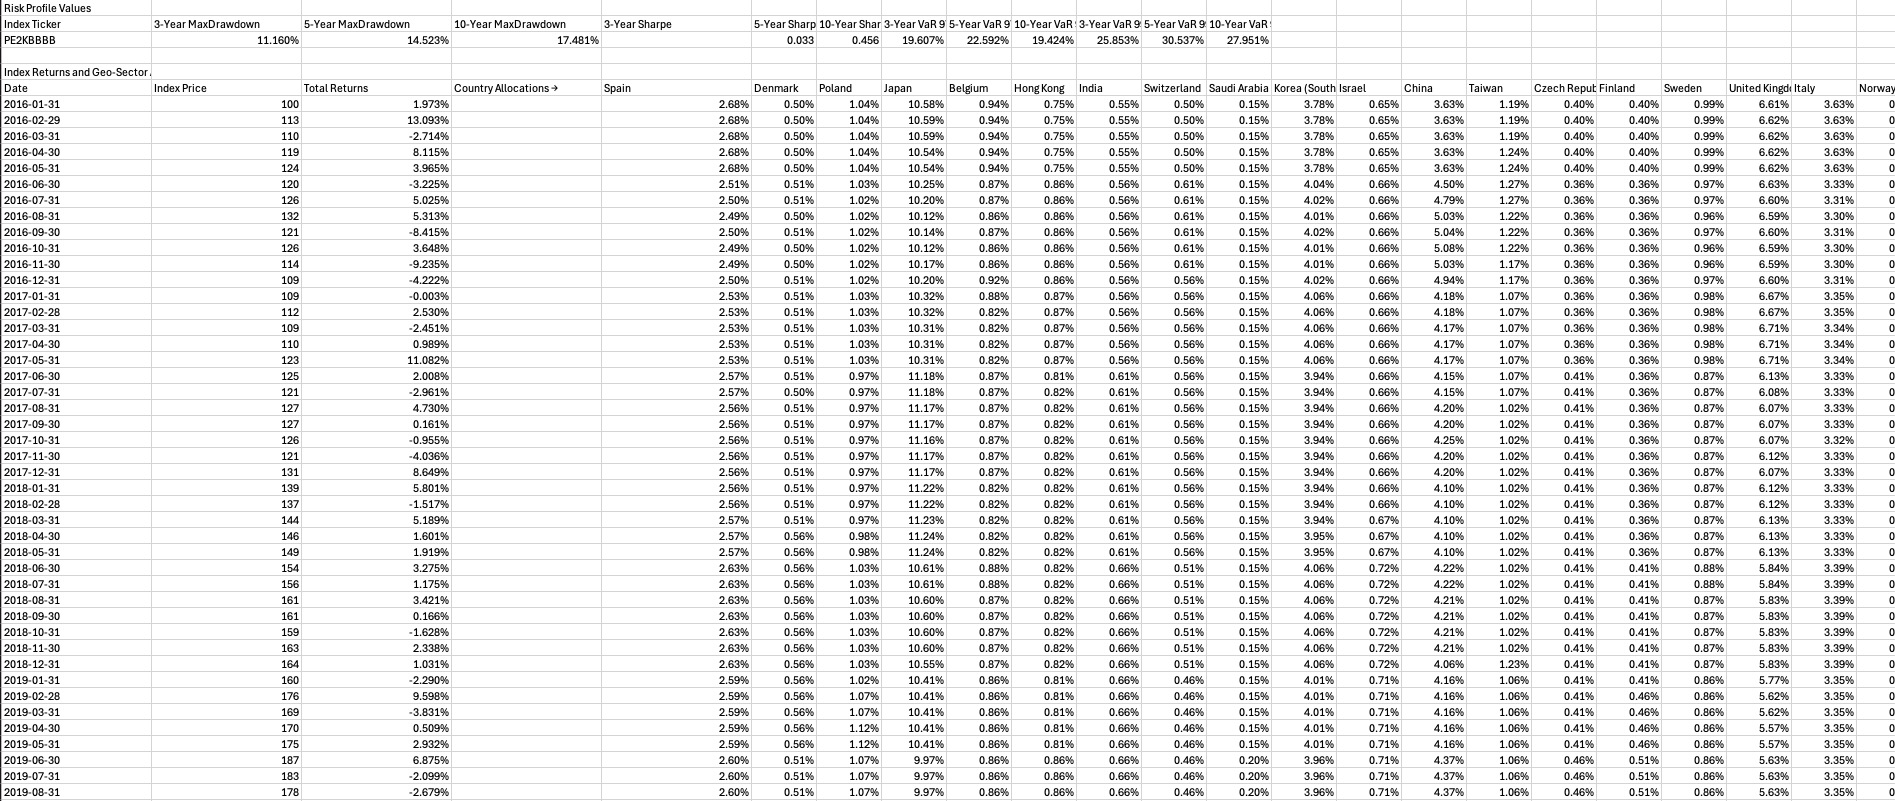
For better clarity, an empty row is added between the Risk Profile Values table and the Index Returns and Geo-Sector Allocations Table, and an empty column is inserted before each allocation group whose header denotes what sector-region allocations the next set of columns denote.