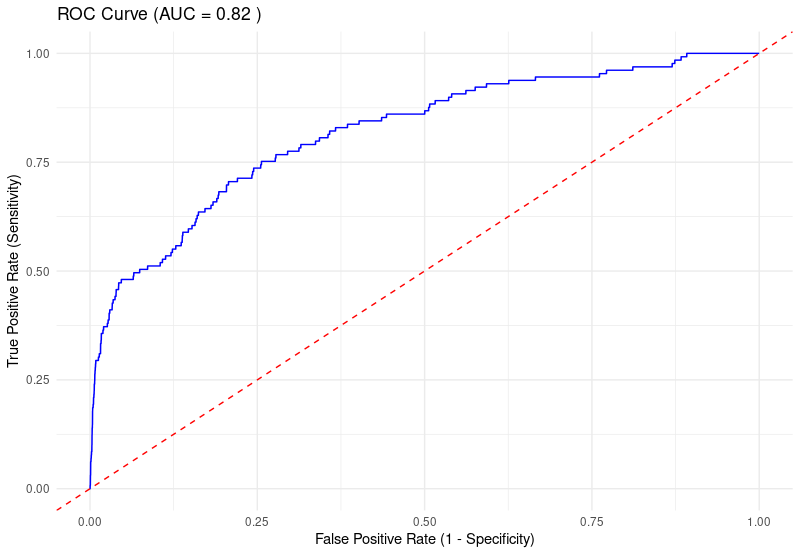
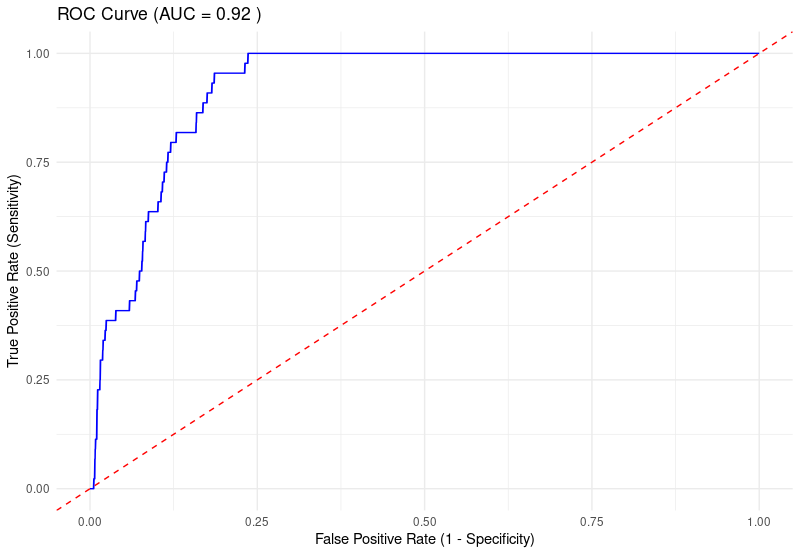
AUC value and ROC curve for the Cox model
The Area Under the Curve (AUC) and Receiver Operating Characteristic (ROC) curve are key metrics for evaluating the performance of a Cox model in distinguishing between events (defaults) and non-events (no defaults). A higher AUC value, closer to 1, indicates a strong predictive ability, while an AUC of 0.5 suggests performance is no better than random chance. The ROC curve, plotting the True Positive Rate against the False Positive Rate, visually assesses the model’s performance across different threshold levels. A curve that remains above the diagonal red line, representing a random classifier, signifies effective discrimination between classes.