
Getting Started
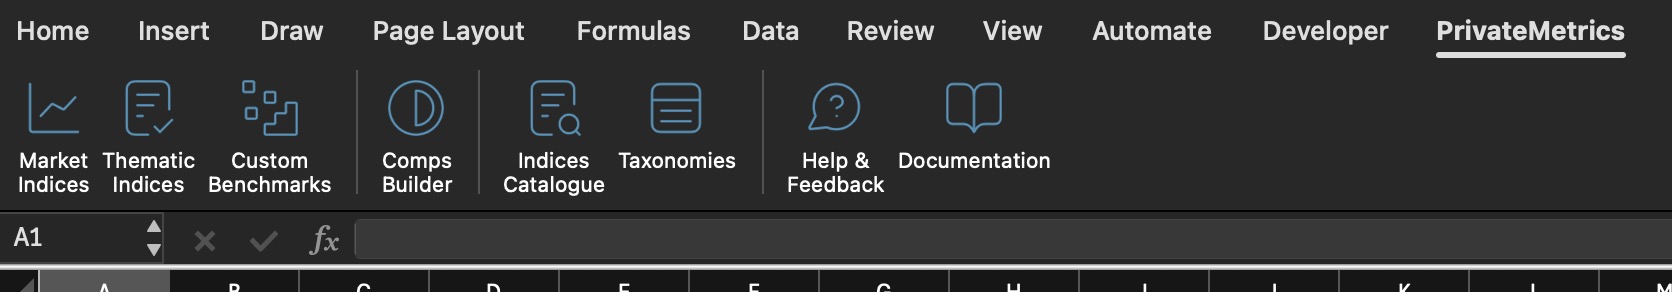
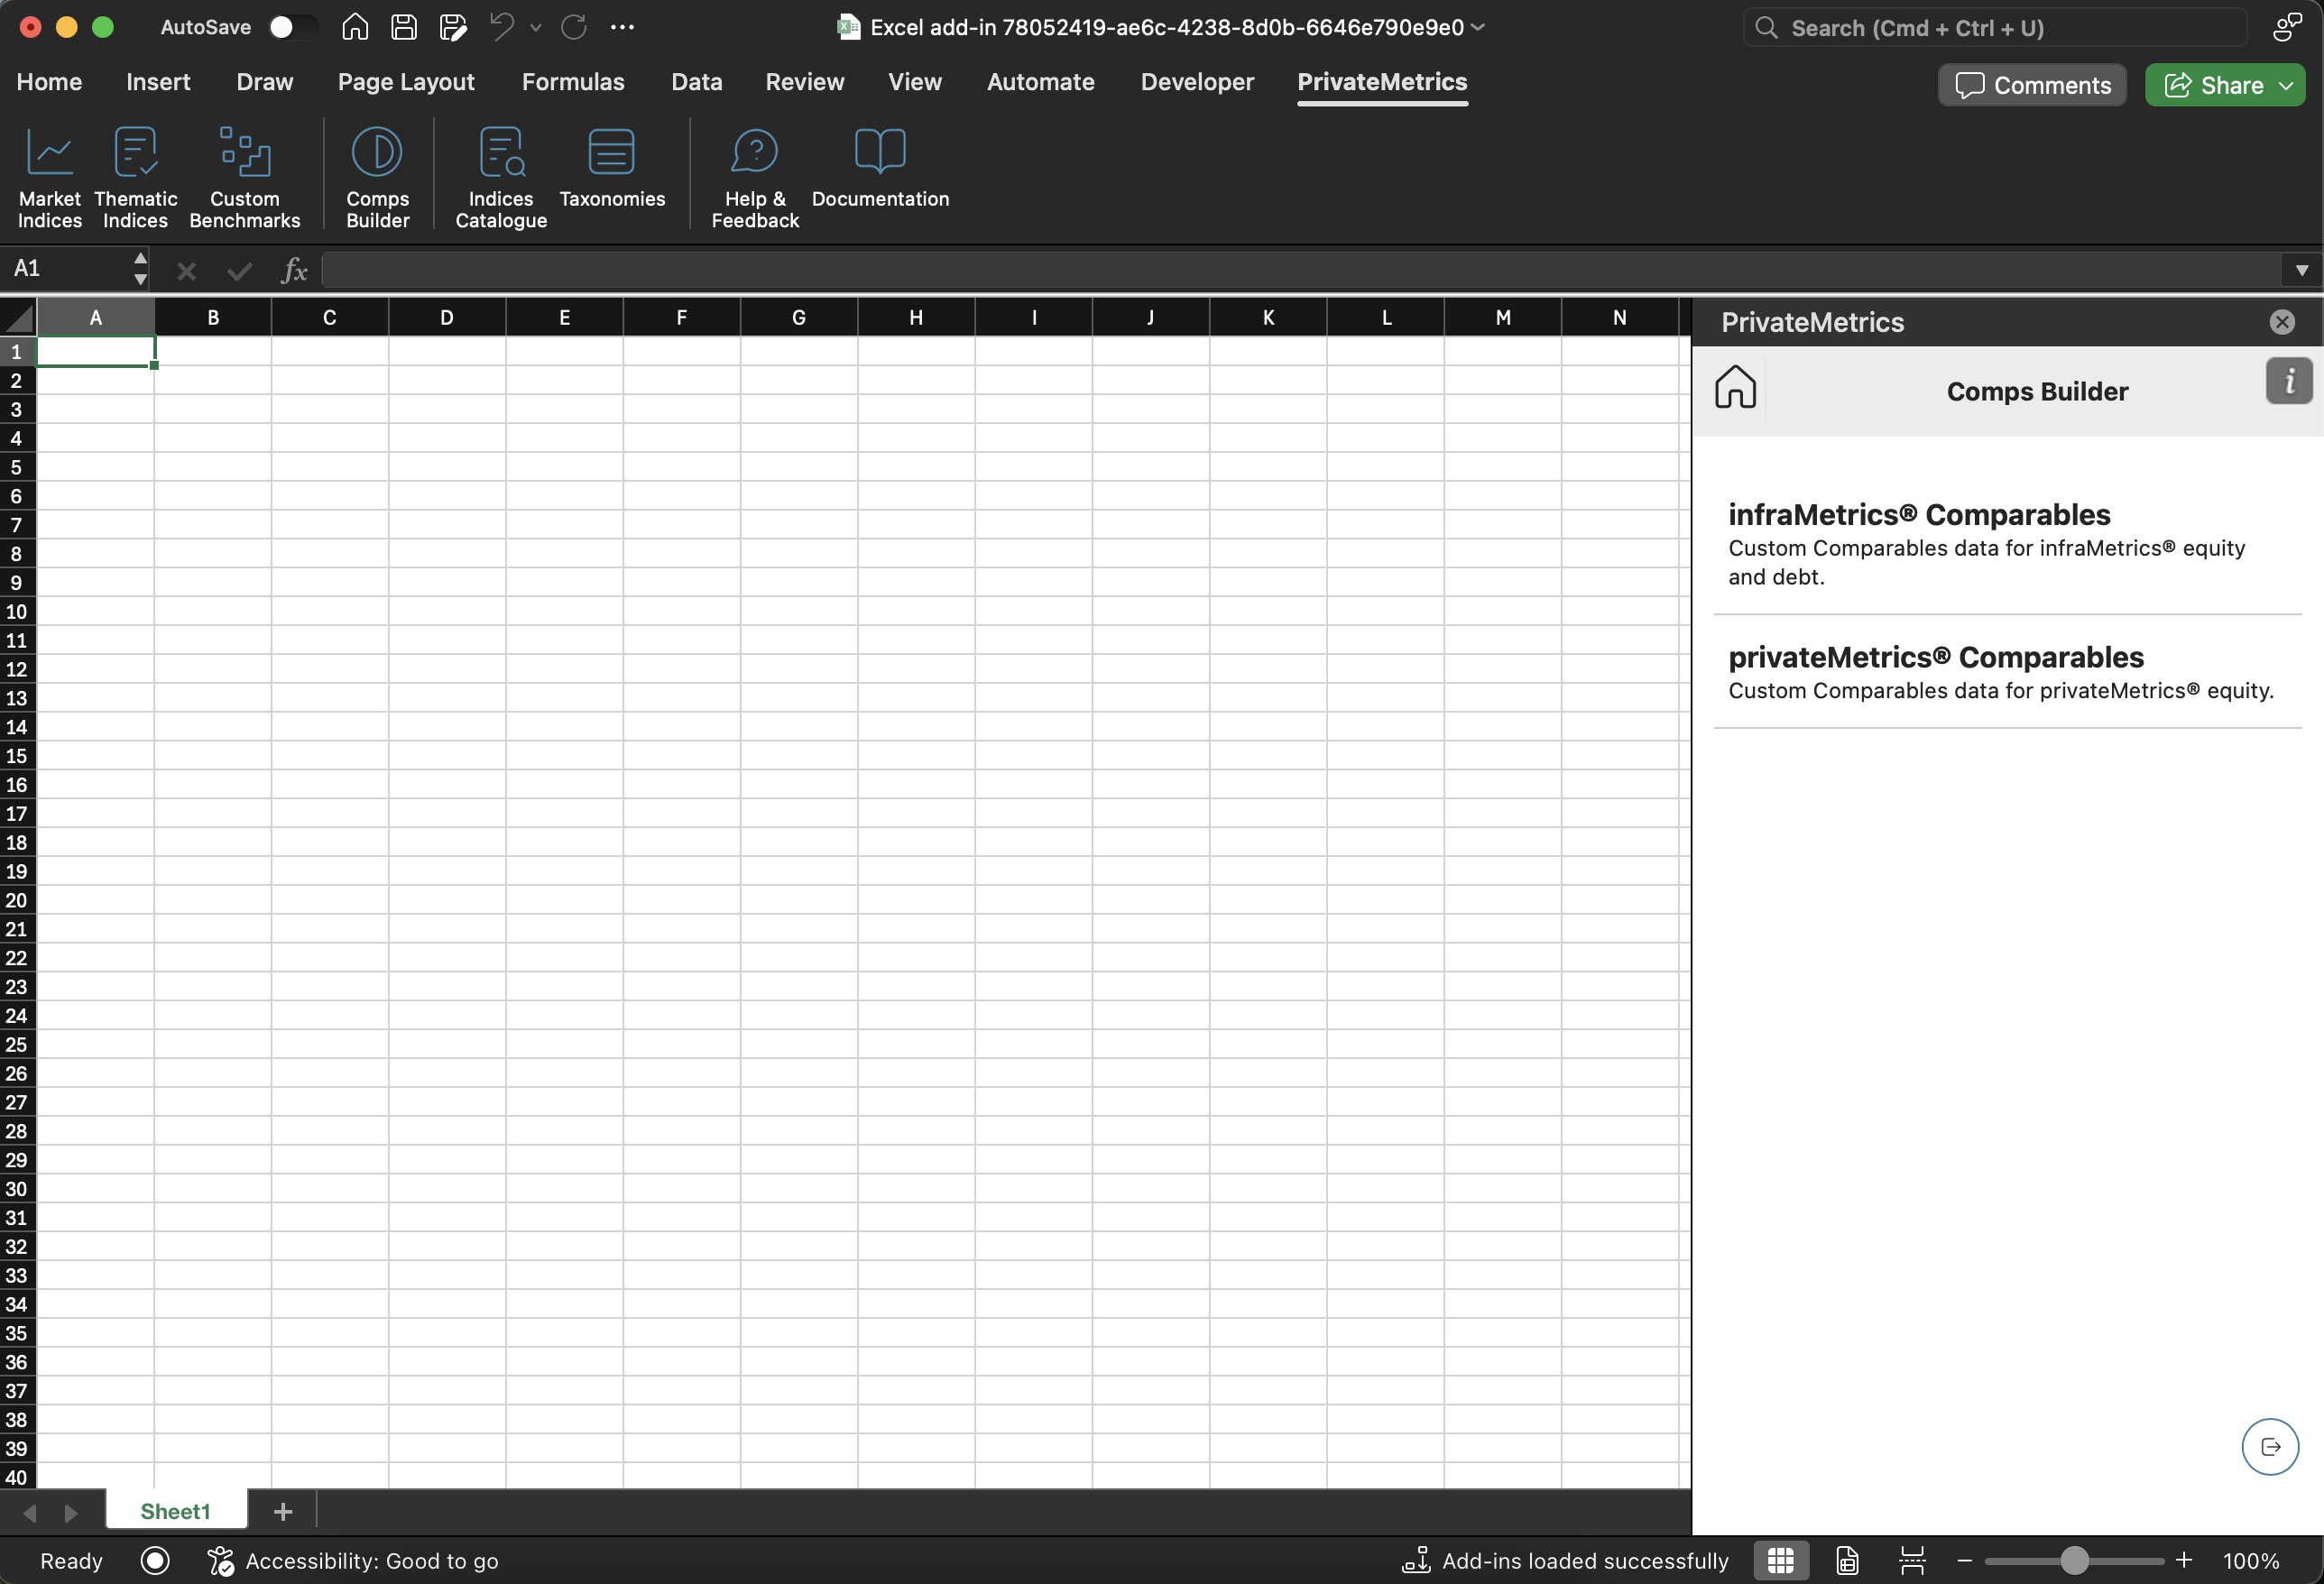
To access the Comps Builder Task Pane, navigate to the PrivateMetrics tab in the Ribbon Toolbar of Excel.
Click on the Comps Builder menu item and if you are logged in, it opens up the landing page, where you can select privateMetrics® Comparables to open the task pane and begin setting up your comparative analysis.
Overview
The Task Pane enables users to create and manage comparative analyses (comps) on various financial metrics using PrivateMetrics® data. This integrated tool within Excel provides an intuitive interface to select metrics, customize filters, and execute queries for detailed financial analysis.
Features
If the user wants to load a template for the Comparables Custom function without using the task pane, they can click on the link “Load an Example”. This will load a template with all the fields and sample values. The computed comparables with all the return values are included along with their description. The users can then add/update the values to calculate the new comparables.
1. Metric Selection
-
Choose between financial metrics such as "Price to Sales," "Price to Earnings," "EV to Sales," "EV to EBITDA," "Price to Book," "Price to EBITDA," and "Total Returns."
2. Date and Age Filtering
-
Value Date: Choose a specific end date and window (in years) to set a cutoff for the data.
-
Age: Define the age of data in months.
3. Geography Segment Filtering
-
Define geographic filters.
4. PECCS® Segments Filtering
-
Define filters based on PECCS® (Private Equity Classification and Coding Standards) pillars or subclasses, such as Industrial Activities, Lifecycle Phase, Revenue Model, Customer Model, Value Chain, and Countries.
-
Use the "Add More" option to include additional PECCS® pillars and subclasses.
5. Risk Profiles
-
Select risk factors like Size, Growth, Profits, Leverage, Term Spread, etc.
-
Choose between Quintile or Factor Value for each risk factor to filter data more precisely.
6. Return Value
-
Choose a statistical operation (e.g., Mean, Median, Min, Max, Percentiles (P25, P50, P75), Observation Count, Company Count, Volatility, VaR 97.5%, VaR 99%) to apply to the selected data.
It should be noted that Volatility, VaR 97.5%, and VaR 99% are disabled if the metric is not “TotalReturns”
7. Query and Reset
-
Query: Executes the query based on the selected filters and displays the results in the Excel sheet.
-
Reset: Clears all selections and resets the form to its default state.
8. Advanced Options Selection
-
Expand Advance Options Sections to
-
Change the currency (USD, EUR, GBP) for the chosen metrics.
-
Choose between different data universes like a Private Equity-backed Universe or a Market Index Universe.
-
Input factors weight to customize the analysis as per the selected universe.
-
Select if the PECCS® filters should be intersected or not
-
Step-by-Step Usage
1. Start
-
Select a financial metric (e.g., Price to Sales).
2. Set Date or Age
-
Choose the link “Switch to Age“ or "Switch to value dates" to set the time period to filter data.
3. Define Geography Segments
-
Click on "Select Geography" to filter data by Regions, Sub-regions, and Countries.
-
To edit or delete, click the respective icons next to the chosen geographies.
4. Define PECCS® Segments
-
Click on "Select PECCS® Pillar" to filter data by specific categories such as Industrial Activities.
-
Add or delete profiles as needed using the icons.
5. Configure Risk Profiles
-
Select factors from the dropdown (e.g., Size).
-
Choose the link “Switch to Factor Value“ or "Switch to Quintiles" to adjust the settings to use either Quintile or Factor Value for more specific filtering.
6. Choose Return Value Operation
-
Select an operation like Mean from the dropdown.
7. Execute Query
-
Click Query to generate results.
8. Reset Form
-
Click Reset to clear all inputs and reset the form.
9. Advanced Options
-
Expand this section to
-
Change your preferred currency from the dropdown. The default is USD.
-
Change the data universe. The default is the Private Equity-backed Universe (PEU).
-
Adjust the Risk profile weights. The default is 1, and users can select values between 0 and 1 in steps of 0.1.
-
Toggle the Intersect PECCS. The default is true.
-
Smart Controls
-
Editing Selections: Click the pencil icon to modify existing filters.
-
Deleting Selections: Click the trash can icon next to each criterion to remove it.
-
Adding More Filters: Use the "Add More" button to add new criteria for a more refined analysis.
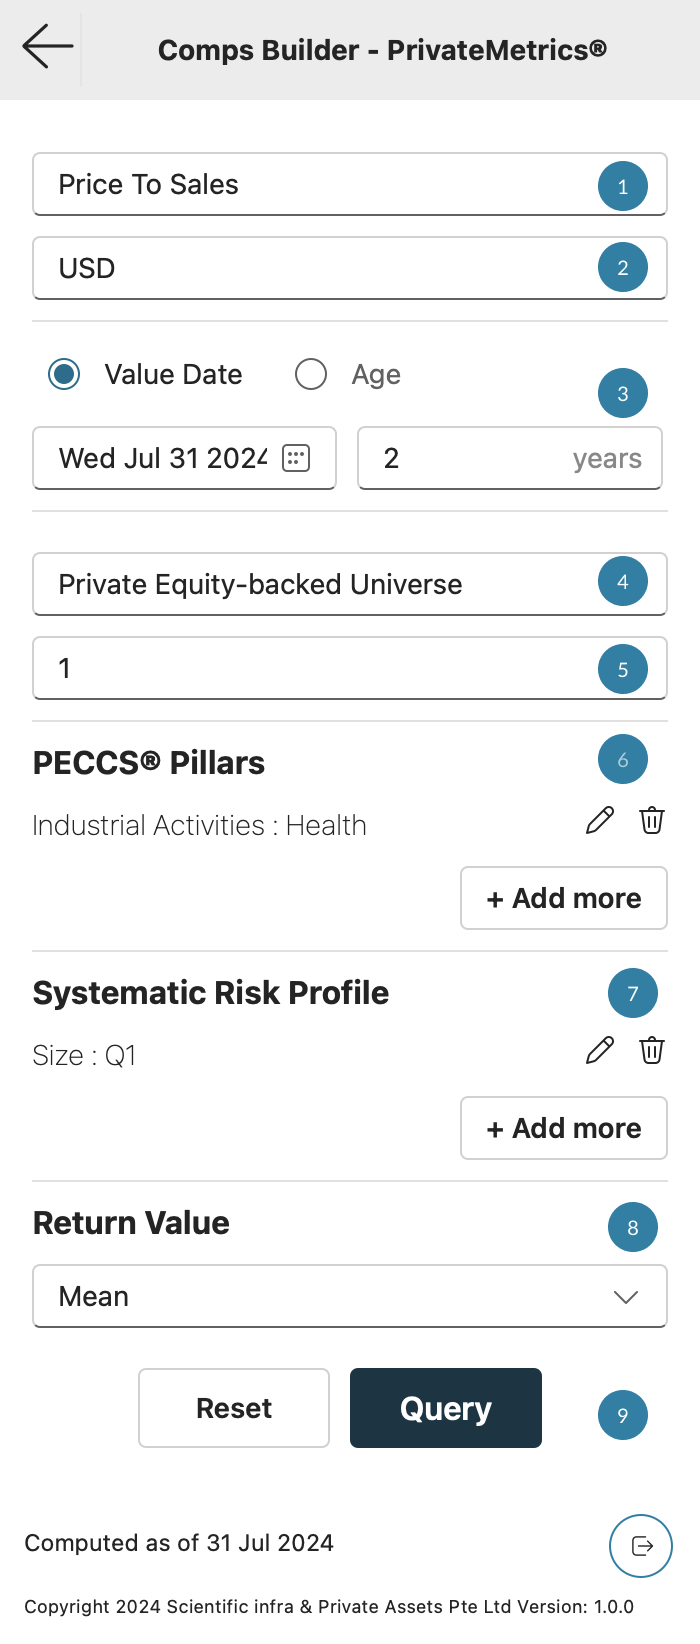
Example Use Case
-
Select Metric: Price to Sales
-
Set Date: Value Date as "Wed Jul 31, 2024."
-
Apply Geographic Segments filters.
-
Add PECCS® Filters: Choose "Industrial Activities: Health."
-
Set Risk Profile: Select "Size" and adjust using Quintile or Factor Value.
-
Choose Return Value: Select "Mean."
-
Execute Query: Click on "Query" to retrieve the data.
-
Advanced Options: By Default currency is set to USD, the universe is set to PEU, risk profile weights are set to 1 and intersect PECCS is set to true. To change, expand the Advanced Options pane and update the desired values.
If all data inputs are correct, the calculated comps will be displayed on the Excel sheet.
Summary
The Comps Builder - PrivateMetrics® Task Pane provides a comprehensive tool for customized financial analysis directly within Excel, offering flexible metric selection, geographic profiling, risk assessment, and sophisticated filtering options. This functionality streamlines the process of building comps for more informed financial decisions. By following the steps outlined above, users can effectively use the Comps Builder to enhance their financial analysis capabilities.