PRIVATE_EQUITY_COMPARABLE_BOUNDARIES (METRIC, AGEINMONTHS, ENDDATE, WINDOWINYEARS,INDUSTRIALACTIVITIES, REVENUEMODELS, CUSTOMERMODELS, LIFECYCLEPHASES, VALUECHAIN, COUNTRIES, UNIVERSE, FACTORWEIGHT )
Parameters
METRIC: Text
The Metric for which the comparable has to be evaluated ("priceToSales", "priceToEbitda", "priceToBook", "priceToEarnings", "evToSales", "evToEbitda", "totalReturns", "ebitdaToSales", "ebitToSales", "netIncomeToSales", "netDebtToAssets", "revenueGrowth", "dividendOverRevenue", "returnOnAssets", "returnOnEquity", "returnOnCapitalEmployed", "netOperatingIncome", "netDebtToEquity", "size", "leverage")
AGEINMONTHS: Number
The age of the company in months. This should be between 24 and 240. The comparable computation will keep companies within 6 months of this value. If set, ENDDATE and WINDOWINYEARS will be ignored.
ENDDATE: Date
The max date of the comparable dataset
WINDOWINYEARS: Number
The window in years of the comparable dataset. In other words, the min date of the comparable dataset = ENDDATE - WINDOWINYEARS
INDUSTRIALACTIVITIES: Range(Text), Text
Comma-separated or cell range selection of industrial activity PECCS code. See here for definitions. (“AC01”, “AC02”, etc..)
REVENUEMODELS: Range(Text), Text
Comma-separated or cell range selection of revenue model PECCS code. See here for definitions. (“RM01”, “RM02”, etc..)
CUSTOMERMODELS: Range(Text), Text
Comma-separated or cell range selection of customer model PECCS code. See here for definitions. (“CM01”, “CM02”, etc..)
LIFECYCLEPHASES: Range(Text), Text
Comma-separated or cell range selection of lifecycle phases PECCS code. See here for definitions. (“LP01”, “LP02”, etc..)
VALUECHAINTYPES: Range(Text), Text
Comma-separated or cell range selection of value chain types PECCS code. See here for definitions. (“VC01”, “VC02”, etc..)
COUNTRIES: Range(Text), Text
Comma-separated or cell range of countries as three-letter ISO code. See here for the possible values of countries
UNIVERSE: Text
“PEU” for PE-backed and “MIU” for Market Index universe. See details on MIU here and on PEU here
FACTORNAME: Text
To determine for which Factor to calculate the quintile boundaries. Possible values are ('Size', ‘Growth', 'Profits', 'Leverage', and 'TermSpread’)
Returns
Reference Table
Examples
If a user wants to evaluate the comparable boundaries for the PriceToSales metric of private equity-backed companies, specifically focusing on companies' size, the custom function will help analyze companies within the PEU (Private Equity Universe) that operate in a specific industrial activity ("AC01"). The function allows the user to filter companies based on factors such as industry, revenue model, lifecycle phase, and geographic location while defining a specific window of time for comparison.
=PRIVATEMETRICS.PRIVATE_EQUITY_COMPARABLE_BOUNDARIES("PriceToSales", , DATE(2024,9,23), "2", "ac01", , , , , , "PEU", "Size")
In this sample use case:
-
Metric: "PriceToSales" is used to evaluate how companies are valued based on their sales.
-
AgeInMonths: Left blank, meaning the comparable set of companies is not filtered based on age.
-
EndDate: Set to
DATE(2024,9,23), meaning the dataset will include companies up to September 23, 2024. -
WindowInYears: Set to "2", indicating the comparable companies will have data from the past two years.
-
IndustrialActivities: "AC01" is used to focus on companies operating within a specific industrial activity code.
-
RevenueModels, CustomerModels, LifecyclePhases, ValueChain: These are left blank, so no filtering is applied based on these factors.
-
Countries: Left blank, meaning no geographic filtering is applied.
-
Universe: "PEU" specifies that the comparison is limited to private equity-backed companies.
-
FactorName: "Size" is used to determine boundaries based on the size of the companies.
This function allows the user to analyze how private equity-backed companies in a particular industrial sector ("AC01") compare in terms of their price-to-sales ratios over a two-year period, with a focus on size as the key factor driving the analysis.
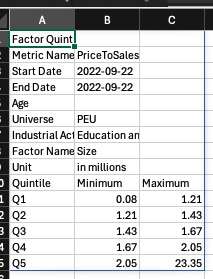
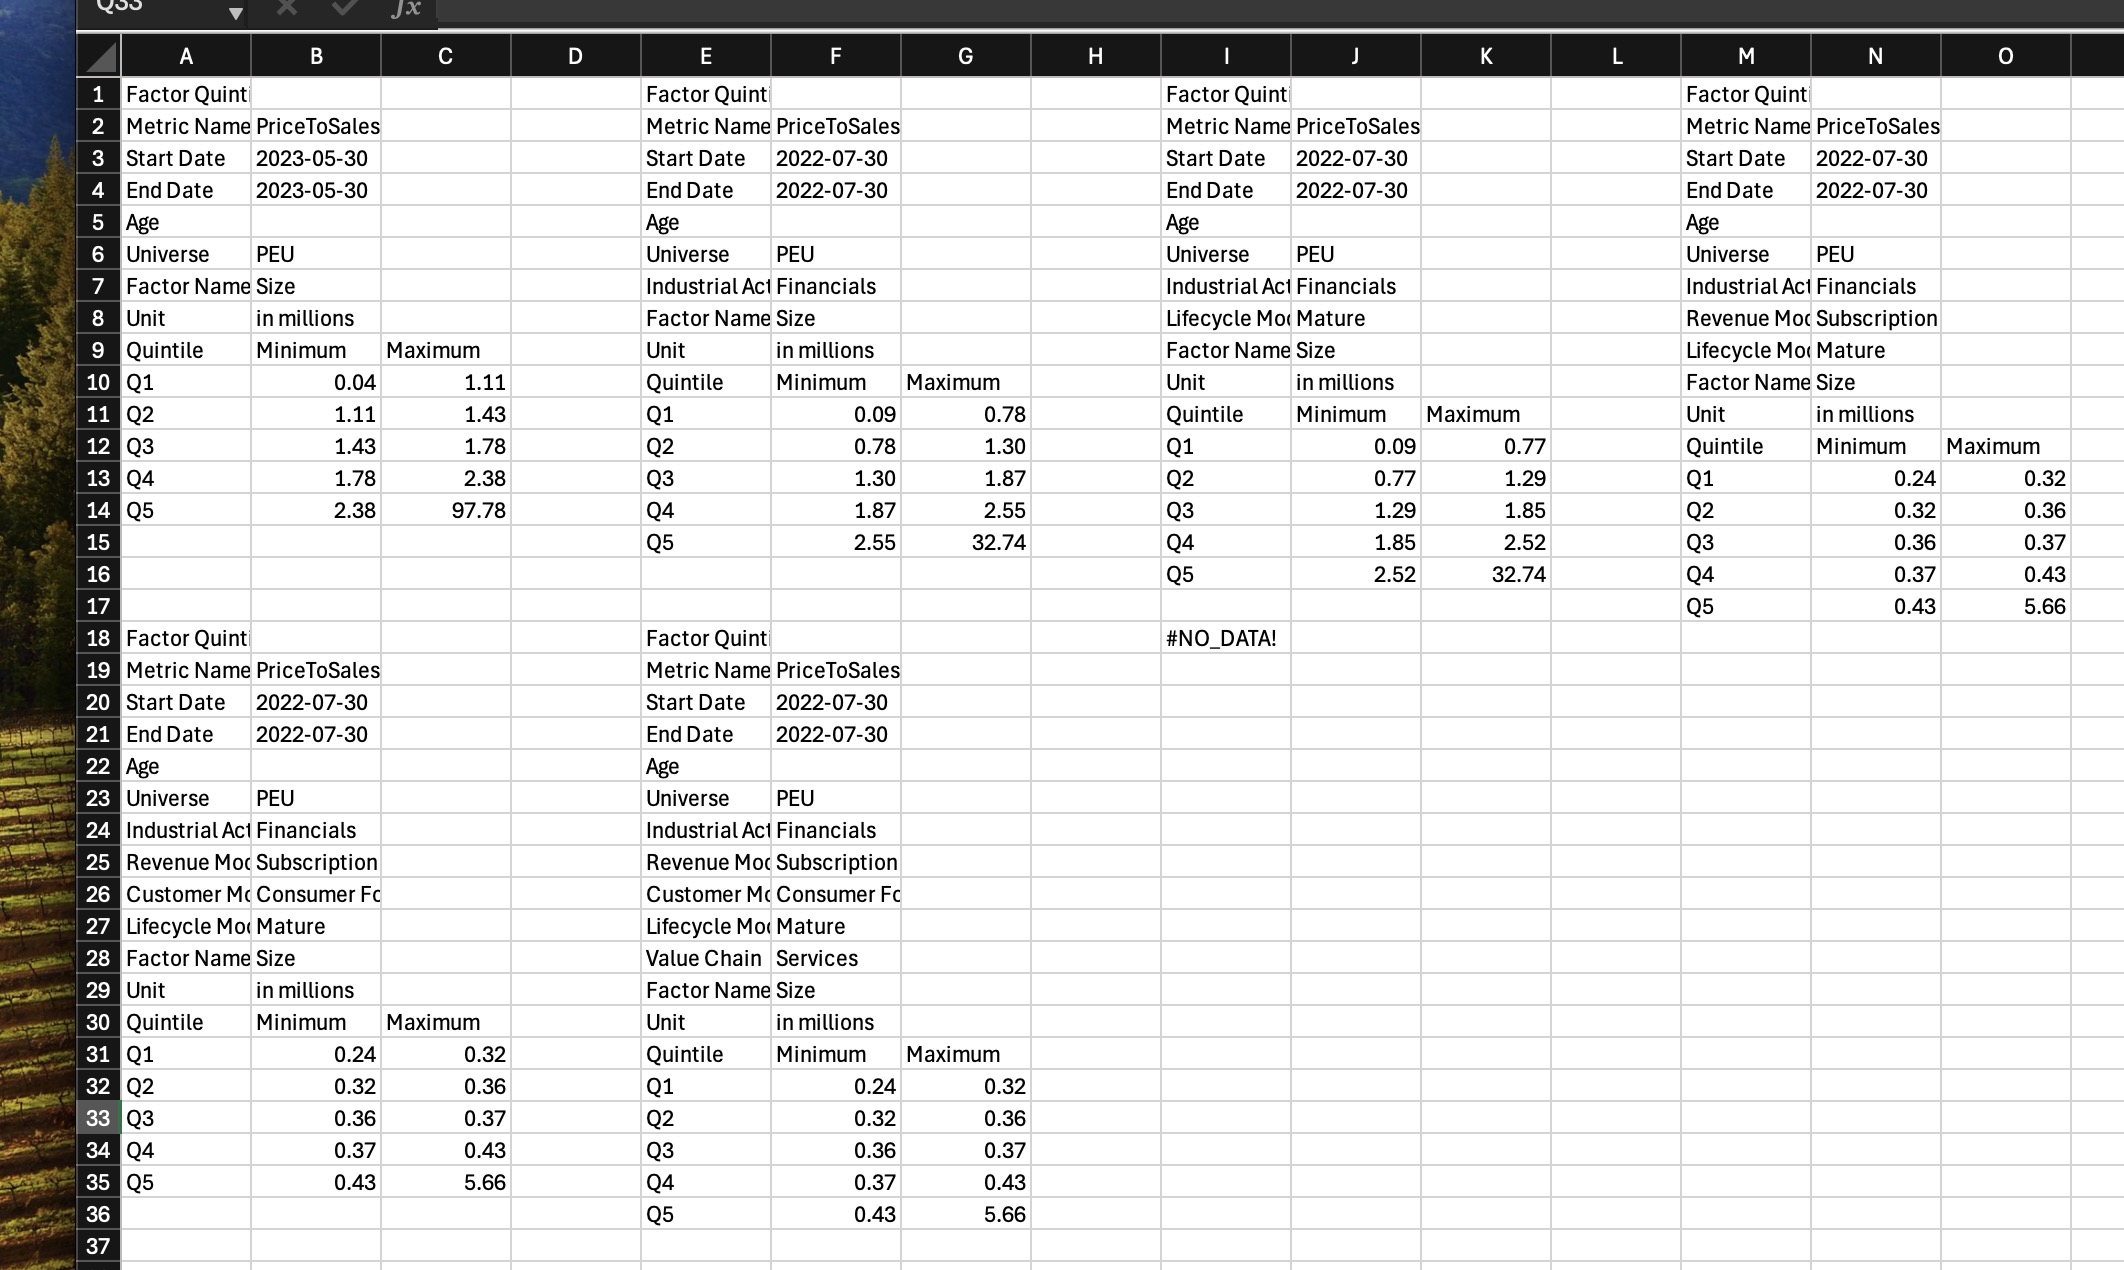
The custom function will return a table like this on the sheet.